Tuesday, December 11, 2018

Remote Sensing Lab 8: Spectral Signature & Resource Monitoring

Goal and Background:

The goal of this lab is to perform basic monitoring of Earth resources using remote sensing band ratio techniques. With the use of the band ratio techniques, one can monitor the health of vegetation and soils. In this lab, there will be gained experience on the measurement and interpretation of spectral reflectance of various Earth surface and near surface materials captured by satellite images. Additionally, there will be the process of collecting spectral signatures from remotely sensed images, graphing them, and then finally, performing an analysis on them.

Methods: 

Erdas Imagine and ArcMap were used to complete this lab.

Part One: Spectral Signature Analysis

The first part of this lab included using an Landsat ETM+ Image taken in 2000 to collect spectral signatures of various Earth surface features.

12 different types of Earth surfaces features were collected and the spectral reflectance was plotted:

  1. Standing Water
  2. Moving Water
  3. Deciduous Forest
  4. Evergreen Forest
  5. Riparian Vegetation
  6. Crops
  7. Dry Soil
  8. Moist Soil
  9. Rock
  10. Asphalt Highway
  11. Airport Runway
  12. Concrete Surface


To start this process, a polygon was drawn on a standing water surface, in this case it was Lake Wissota. Next, the Raster tools were activated and Supervised was chosen and then finally Signature Editor was selected. Once the Signature Editor window opened, the Create New Signatures from AOI was clicked to add the previously drawn polygon (Figure 1). The default value of Class was changed to Standing Water. By clicking on the Display Mean Plot Window tool in the Signature Editor window, the spectral plot of the signature will be shown. This same process was then completed for the remaining 11 Earth surface features (Figure 2).

Figure 1: New Signature Created From the Drawn Polygon

Figure 2: All 12 Signatures

Part Two: Resource Monitoring

Part two of this lab is where basic monitoring of Earth resources using remote sensing band ratio techniques to monitor the health of vegetation and soils were performed. 

Section One: Vegetation Health Monitoring

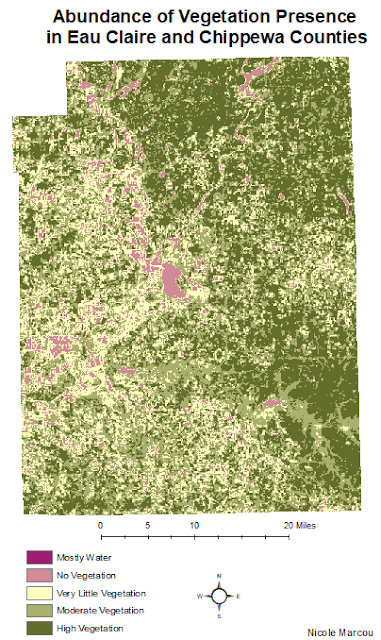
First, a simple band ratio was performed by implementing the normalized difference vegetation index (NDVI) on an image of Eau Claire and Chippewa counties.  This index is computed as so: NDVI=(NIR-Red)/(NIR+Red). To start this process, the Raster tools were activated and Unsupervised was chosen and then NDVI was selected. After the parameters were set, the NDVI image was created. Lastly, the NDVI image was opened in ArcMap to create a map displaying the abundance of vegetation in Eau Claire and Chippewa counties. 

Section Two: Soil Health Monitoring

First, a simple band ratio was performed by implementing the ferrous mineral ratio on an image of Eau Claire and Chippewa counties. This ratio is computed as so: Ferrous mineral=(MIR)/(NIR). To start this process, the Raster tools were activated and Unsupervised was chosen and then Indices was selected. After the parameters were set, the ferrous minerals image was created. Next, the ferrous minerals image was opened in ArcMap to create a map displaying the spatial distribution of ferrous minerals in Eau Claire and Chippewa counties. 

Results

Although each curve is different, there are three main trends that can be observed from the overall results (Figure 3). The deciduous forest, evergreen forest and riparian vegetation surfaces all generally follow the same trend of curves from Band 1 to Band 6. This makes sense due to similar vegetation and most likely similar moisture content. The standing water and moving water surfaces almost followed the exact curving trend from Band 1 to Band 2 because they are both water surfaces. The surfaces of moist soil, rock, asphalt highway and concrete surface also all had curves that followed similar trends from Band 1 to Band 6. This could be explained by the fact that they are all relatively flat surfaces. 

Figure 3: The 12 Signatures Plotted
 The results from the NDVI index display the difference in vegetation in Eau Claire and Chippewa counties (Figure 4). The heaviest vegetation is located in the northeast region of Chippewa County. It is interesting that known water surfaces in this image are labeled as No Vegetation and not Mostly Water.

Figure 4: Differences in Vegetation


The results from the ferrous minerals indices display the differences in minerals across both counties (Figure 5). The northeast region of Chippewa County has the largest area of mostly vegetation between both counties. The areas of high and moderate ferrous minerals are in the same spatial regions where the mostly water and no vegetation regions are in the vegetation map. The western sides of both counties are where the overall abundance of high and moderate ferrous minerals are located. Specifically, there is a large cluster of moderate and high ferrous minerals around the northwestern side of Lake Wissota. 


Figure 5: Differences in Ferrous Minerals

Sources:

Satellite image is from Earth Resources Observation and Science Center, United States Geological Survey

Thursday, December 6, 2018

Remote Sensing Lab 7: Photogrammetry

Goal and Background:

The goal of this lab is to learn key photogrammetry skills by completing tasks on satellite images and aerial photographs. A few specifics of this lab include: calculating relief displacement, measurement of areas and perimeters of features, and developing the understanding of the mathematics behind the calculation of photographic scales. This lab is an introduction to performing orthorectification on satellite images and stereoscopy.


Methods: 

Erdas Imagine was used to complete this lab.


Part One: Scales, Measurements and Relief Displacement


The first part of this lab included determining the scale for aerial photographs. The first calculation was S=PH/GD. A ruler was used to measure the distance between two points on the aerial photograph. The remaining numbers that replaced the values of the equation were provided in the lab. The equation appeared as so before if was solved: S=2.5in(2.5)/8822.74(2.5)ft. 


The second calculation was S=f/(H-h). A ruler was used to measure the distance between two points on the aerial photograph. Once again, the remaining numbers that replaced the values of the equation were provided in the lab. The equation appeared as so before it was solved: S=152mm/(20,000ft - 796ft).


The last section of part one used a calculation for relief displacement in the aerial photograph. This calculation was D=hxr/H. A ruler was used to measure the height of a smoke stack in the photo. Again, the remaining numbers that replaced the values of the equation were provided by the lab. The equation appeared as so before it was solved: D=1379x10.5/390x12.


Part Two: Stereoscopy

In the second part of the lab, GCPs were used to create an anaglyph of the city of Eau Claire. To start this process, an image of Eau Claire was brought into one viewer and a DEM of the same area was brought into a second viewer. Next, the anaglyph tool was used to create the output image. This same process was completed again with the same Eau Claire image but instead of a DEM, a DSM was used. The anaglyph tool was used to create the output image between the Eau Claire image and the DSM. 

Part Three: Orthorectification

In this part of the lab, a planimetrically correct orthoimage was created using the Erdas Lecia Photogrammetric Suite (LPS). A SPOT satellite image and an orthorectified aerial photo were both used as the sources for ground control measurements.

A total of 12 GCP points were collected. The first two were added manually (Figure 1) the remaining points were added using the automatic (x.y) drive function to approximate the GCP location in the image file based on the GCP position in the reference image.


Figure 1: Adding the First Two GCP's
After collecting all of the points, a triangulation was performed. This establishes the mathematical relationship between the images in the block file, the sensor model, and the ground. After running the model the triangulation report was verified to make sure the model ran correctly (Figure 2). This step supplies the exterior orientation information needed. 


Figure 2: Summary of Triangulaiton

Lastly, the orthorectification process was completed that removes relief displacements and other geometric errors to create an image that displays objects in their correct x, y positions. At this time all of the necessary columns are green in the Photogrammetry Interface indicating that all of the processes have been completed (Figure 3). 


Figure 3: Status of Photogrammetry Interface
Results:

Part One:


Calculation one: 1:42,349

Calculation two: 1:38,509
Calculation three: 0.3inches

Part Two:

The results from the using the anaglyph tool (Figure 4). The anaglyph image on the left was created with the DEM and the anaglyph image on the right was created with the DSM. The DSM represents all features on the ground surface and the DEM only represents the bare earth ground which is why the DSM has better quality. Using 3D glass, features such as vegetation appear 3D in the DSM anaglyph image. 


Figure 4: The anaglyph image on the left was created with the DEM and the anaglyph image on the right was created with the DSM. 

Part Three:

The results from the orthorectified images (Figure 5). The degree of accuracy of spatial overlap at the boundaries of the two orthorectified images is very high. With the use of the Swipe tool, I noticed that the river leading off the border of one of the orthorectified images to the other looks very smooth and almost perfect. I also examined the connections of roads between both orthorectified images and they look like they almost line up perfectly as well. There is spatial accuracy with natural features as well as man made features.


Figure 5: Results from the Orthorectified Images


Sources:

National Agriculture Imagery Program (NAIP) images are from United States Department of Agriculture, 2005.
Digital Elevation Model (DEM) for Eau Claire, WI is from United States Department of Agriculture Natural Resources Conservation Service, 2010.
Lidar-derived surface model (DSM) for sections of Eau Claire and Chippewa County are from Eau Claire County and Chippewa County governments.
Spot satellite images are from Erdas Imagine, 2009.
Digital elevation model (DEM) for Palm Spring, CA is from Erdas Imagine, 2009. 
National Aerial Photography Program (NAPP) 2 meter images are from Erdas Imagine, 2009.