The goal of this lab is to perform basic monitoring of Earth resources using remote sensing band ratio techniques. With the use of the band ratio techniques, one can monitor the health of vegetation and soils. In this lab, there will be gained experience on the measurement and interpretation of spectral reflectance of various Earth surface and near surface materials captured by satellite images. Additionally, there will be the process of collecting spectral signatures from remotely sensed images, graphing them, and then finally, performing an analysis on them.
Methods:
Erdas Imagine and ArcMap were used to complete this lab.
Part One: Spectral Signature Analysis
The first part of this lab included using an Landsat ETM+ Image taken in 2000 to collect spectral signatures of various Earth surface features.
12 different types of Earth surfaces features were collected and the spectral reflectance was plotted:
- Standing Water
- Moving Water
- Deciduous Forest
- Evergreen Forest
- Riparian Vegetation
- Crops
- Dry Soil
- Moist Soil
- Rock
- Asphalt Highway
- Airport Runway
- Concrete Surface
To start this process, a polygon was drawn on a standing water surface, in this case it was Lake Wissota. Next, the Raster tools were activated and Supervised was chosen and then finally Signature Editor was selected. Once the Signature Editor window opened, the Create New Signatures from AOI was clicked to add the previously drawn polygon (Figure 1). The default value of Class was changed to Standing Water. By clicking on the Display Mean Plot Window tool in the Signature Editor window, the spectral plot of the signature will be shown. This same process was then completed for the remaining 11 Earth surface features (Figure 2).
 |
| Figure 1: New Signature Created From the Drawn Polygon |
 |
| Figure 2: All 12 Signatures |
Part Two: Resource Monitoring
Part two of this lab is where basic monitoring of Earth resources using remote sensing band ratio techniques to monitor the health of vegetation and soils were performed.
Section One: Vegetation Health Monitoring
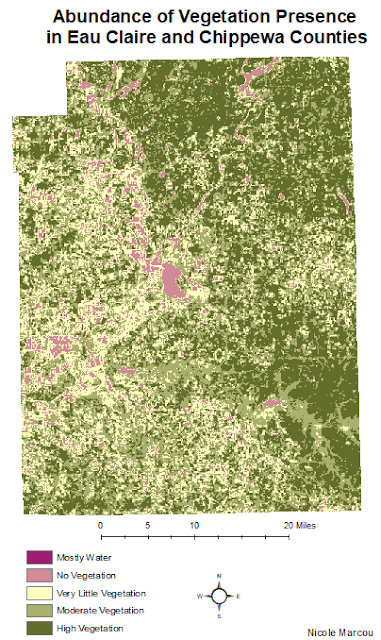
First, a simple band ratio was performed by implementing the normalized difference vegetation index (NDVI) on an image of Eau Claire and Chippewa counties. This index is computed as so: NDVI=(NIR-Red)/(NIR+Red). To start this process, the Raster tools were activated and Unsupervised was chosen and then NDVI was selected. After the parameters were set, the NDVI image was created. Lastly, the NDVI image was opened in ArcMap to create a map displaying the abundance of vegetation in Eau Claire and Chippewa counties.
Section Two: Soil Health Monitoring
First, a simple band ratio was performed by implementing the ferrous mineral ratio on an image of Eau Claire and Chippewa counties. This ratio is computed as so: Ferrous mineral=(MIR)/(NIR). To start this process, the Raster tools were activated and Unsupervised was chosen and then Indices was selected. After the parameters were set, the ferrous minerals image was created. Next, the ferrous minerals image was opened in ArcMap to create a map displaying the spatial distribution of ferrous minerals in Eau Claire and Chippewa counties.
Results
Although each curve is different, there are three main
trends that can be observed from the overall results (Figure 3). The deciduous forest,
evergreen forest and riparian vegetation surfaces all generally follow the same
trend of curves from Band 1 to Band 6. This makes sense due to similar
vegetation and most likely similar moisture content. The standing water and
moving water surfaces almost followed the exact curving trend from Band 1 to
Band 2 because they are both water surfaces. The surfaces of moist soil, rock,
asphalt highway and concrete surface also all had curves that followed similar
trends from Band 1 to Band 6. This could be explained by the fact that they are
all relatively flat surfaces.
 |
| Figure 3: The 12 Signatures Plotted |
 |
| Figure 4: Differences in Vegetation |
The results from the ferrous minerals indices display the differences in minerals across both counties (Figure 5). The northeast region of Chippewa County has the
largest area of mostly vegetation between both counties. The areas of high and
moderate ferrous minerals are in the same spatial regions where the mostly
water and no vegetation regions are in the vegetation map. The western sides of
both counties are where the overall abundance of high and moderate ferrous minerals
are located. Specifically, there is a large cluster of moderate and high
ferrous minerals around the northwestern side of Lake Wissota.
 |
| Figure 5: Differences in Ferrous Minerals |
Sources:
Satellite image is from Earth Resources Observation and Science Center, United States Geological Survey
No comments:
Post a Comment